Designing the central nervous system for internal operations and the public face of the company's growth.
My Role:
Product Designer
User Base:
Internal Teams, Investors and External Partners
Project Suite:
Varaha Studio, Partner Financial Portal & Website
Challenge:
Translating massive, complex datasets into actionable interfaces for diverse stakeholders (Investors, internal Ops, Partners).
The "Gateway" Discovery (Solo)
Context:
This was my first project at Varaha—my "gateway" to understanding the entire business logic. At the time, there was no Product Manager.
Problem:
Partners managing field agents are paid based on the volume of valid data collected. The existing solution was a basic Looker Studio dashboard that was opaque. If a partner wasn't paid, they didn't know if it was due to agent error or a tech glitch, leading to a lack of trust
Status Quo:
The entire partner ecosystem ran on a basic Looker Studio dashboard. Partners (who manage agents) are paid based on "valid data," but when payments were withheld, the Looker sheet couldn't tell them why.
Goal:
I had to map the business teams and structures to understand how to build transparency between the company and the partners.
The Technical Reality Check
Constraint:
I initially wanted to design a rich, visual interface ("The Design Way"). However, deep collaboration with Backend Developers revealed that querying complex validation data for thousands of farms would drastically increase loading times.
Compromise:
We had to factor in these backend complications. I pivoted the design to focus on utility over visuals, creating a lightweight structure that could load quickly while still exposing the necessary data.
The Strategic Reset (PM Joins)
Feedback Loop:
As I was working, a Product Manager joined the team. We incorporated direct feedback from partners who wanted to not just see the data, but raise queries about it.
Solution:
We built a "Dispute Resolution" flow. If a partner wasn't paid, they could see the specific validation error and raise a formal request right there in the dashboard, solving the trust gap.
Impact
Operational Trust:
The dashboard successfully established transparency. Partners could finally see why payments were withheld and contest it if necessary.
Design Language Foundation:
This project established the first design language (tables, status tags, filters) that was later integrated into the larger Varaha Studio, setting the standard for future tools.


The "Institutional Knowledge" Sprint (7 Days)
Crunch:
We needed a unified dashboard to show investors that our ground data was real, with a deadline of just one week.
Bypass:
I didn't have time for user research. Instead, I leveraged my deep understanding of the specific workflows for Biochar, Regen, and ARR to architect the system from memory. I knew exactly what the operations team needed because I had been embedded in their processes for years.
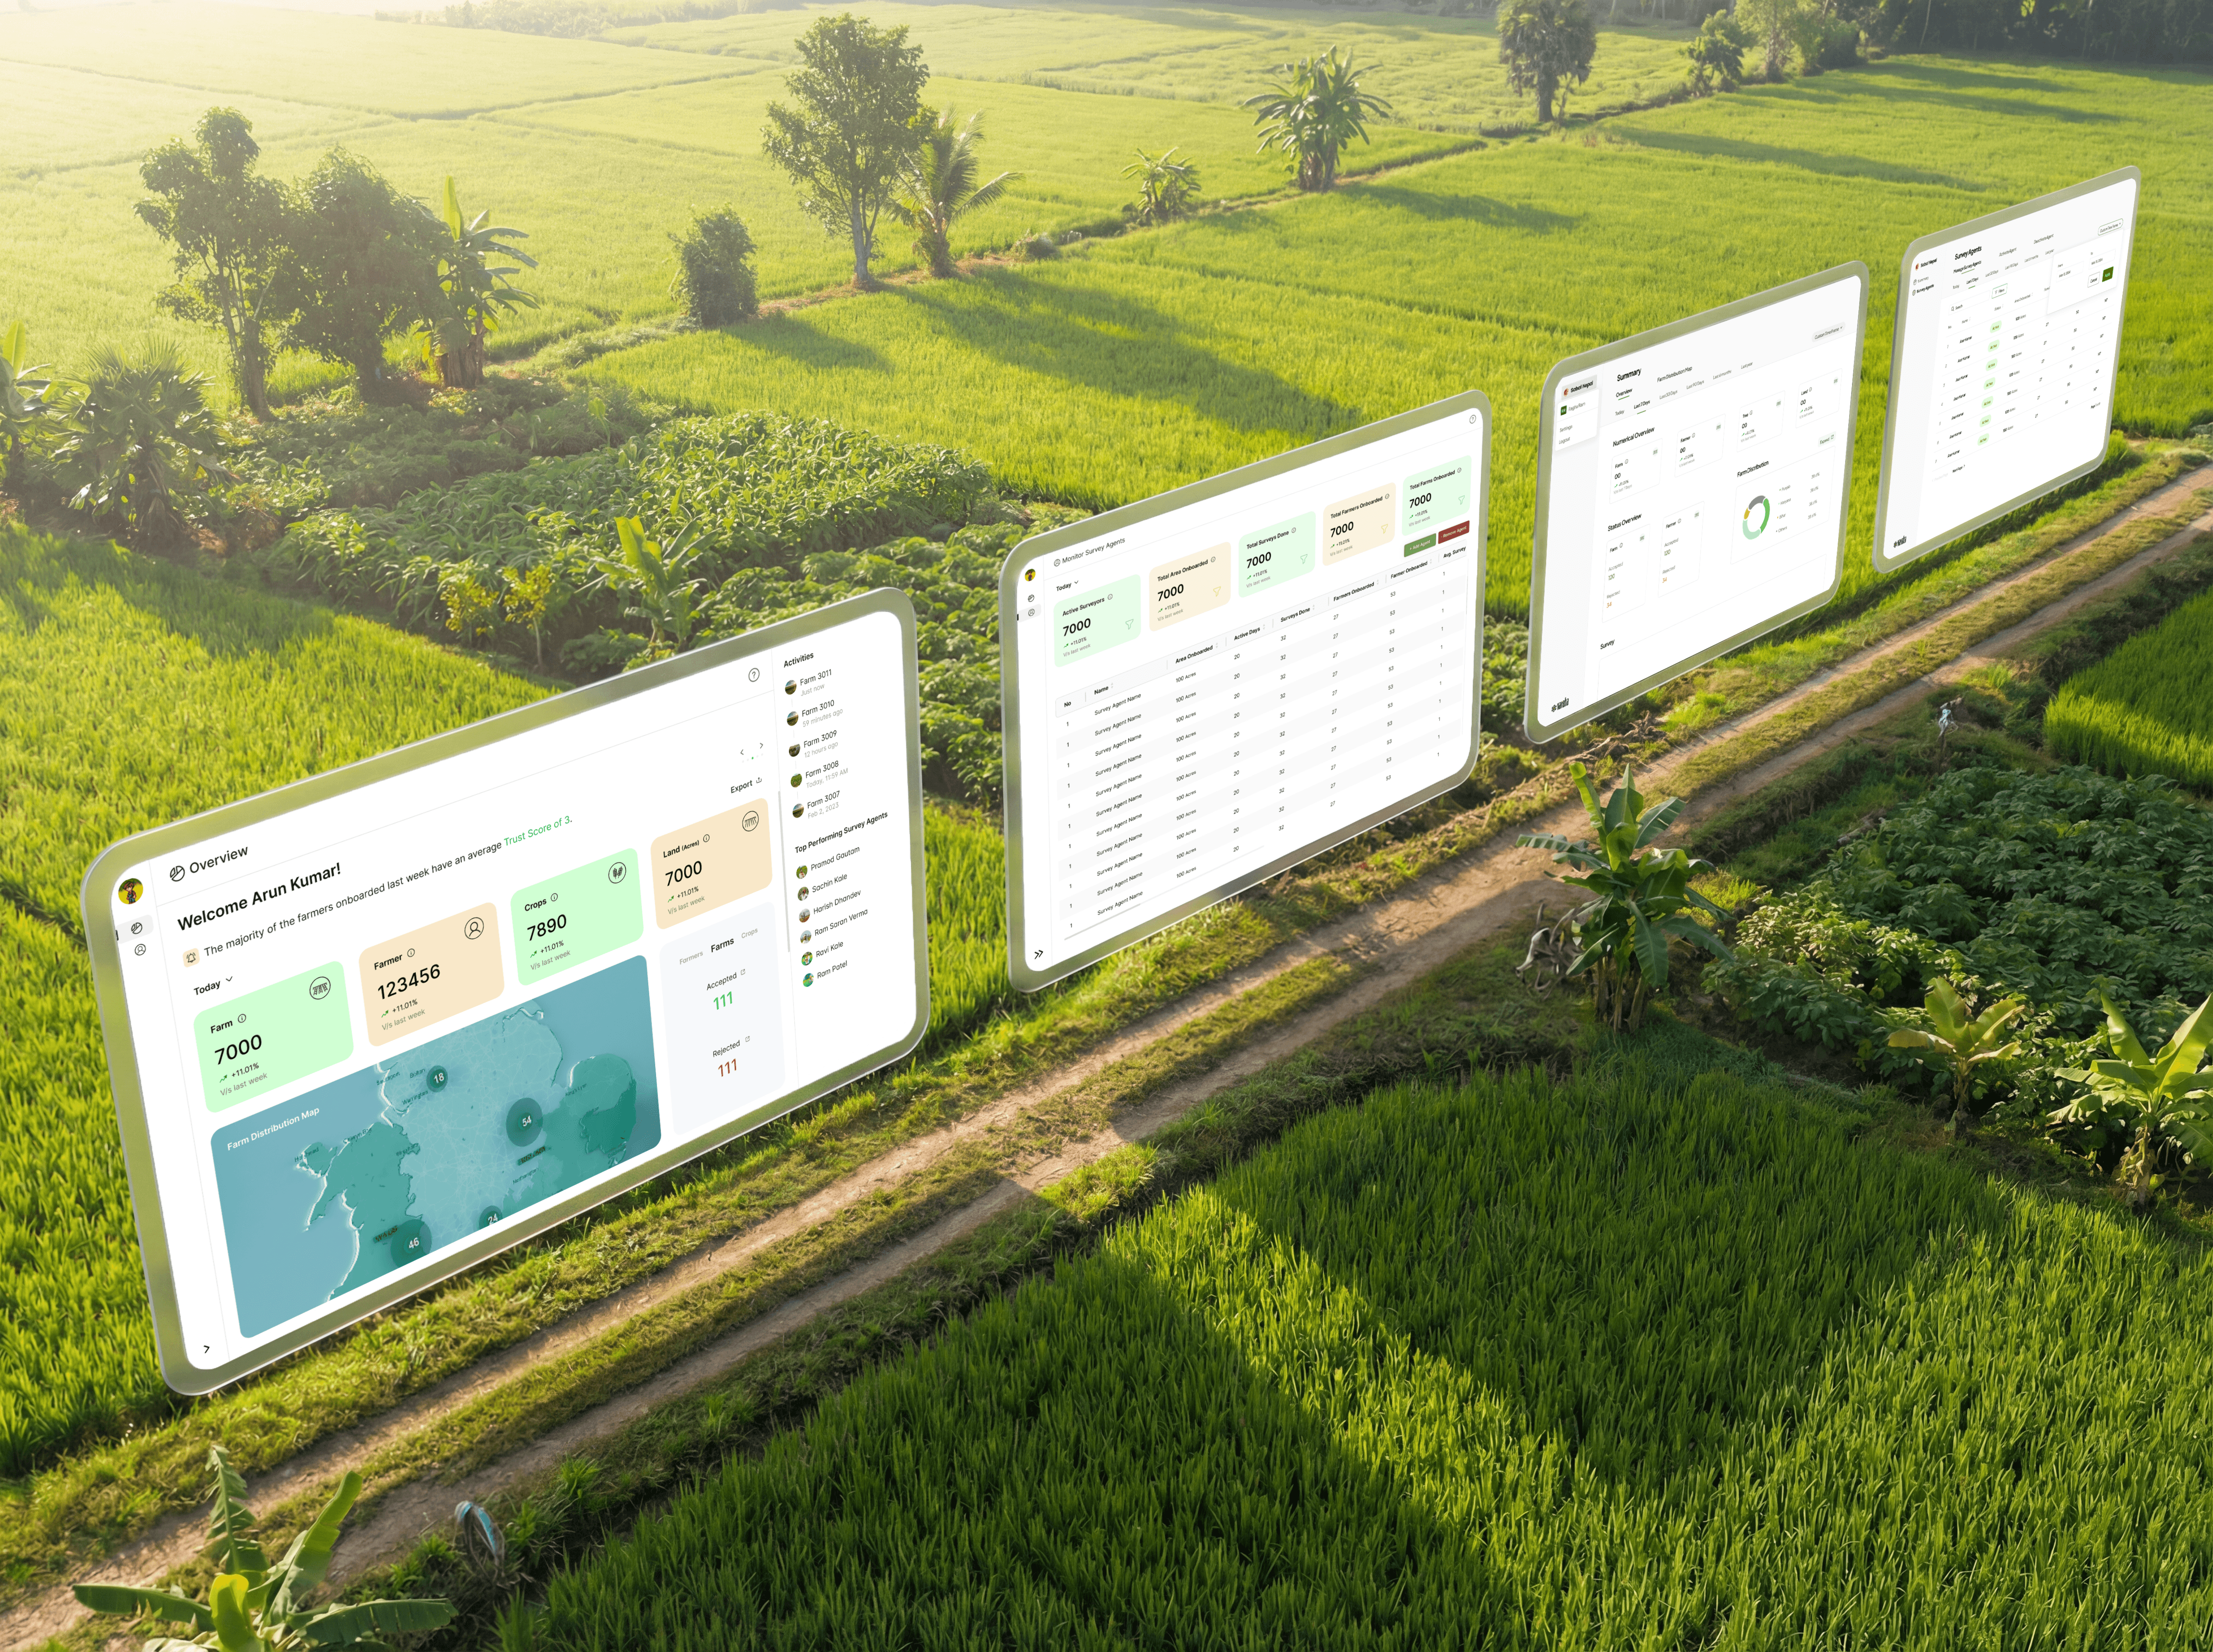
Output:
A functional "God View" demo that allowed investors to drill down from a country level to a specific farm, proving our data integrity.
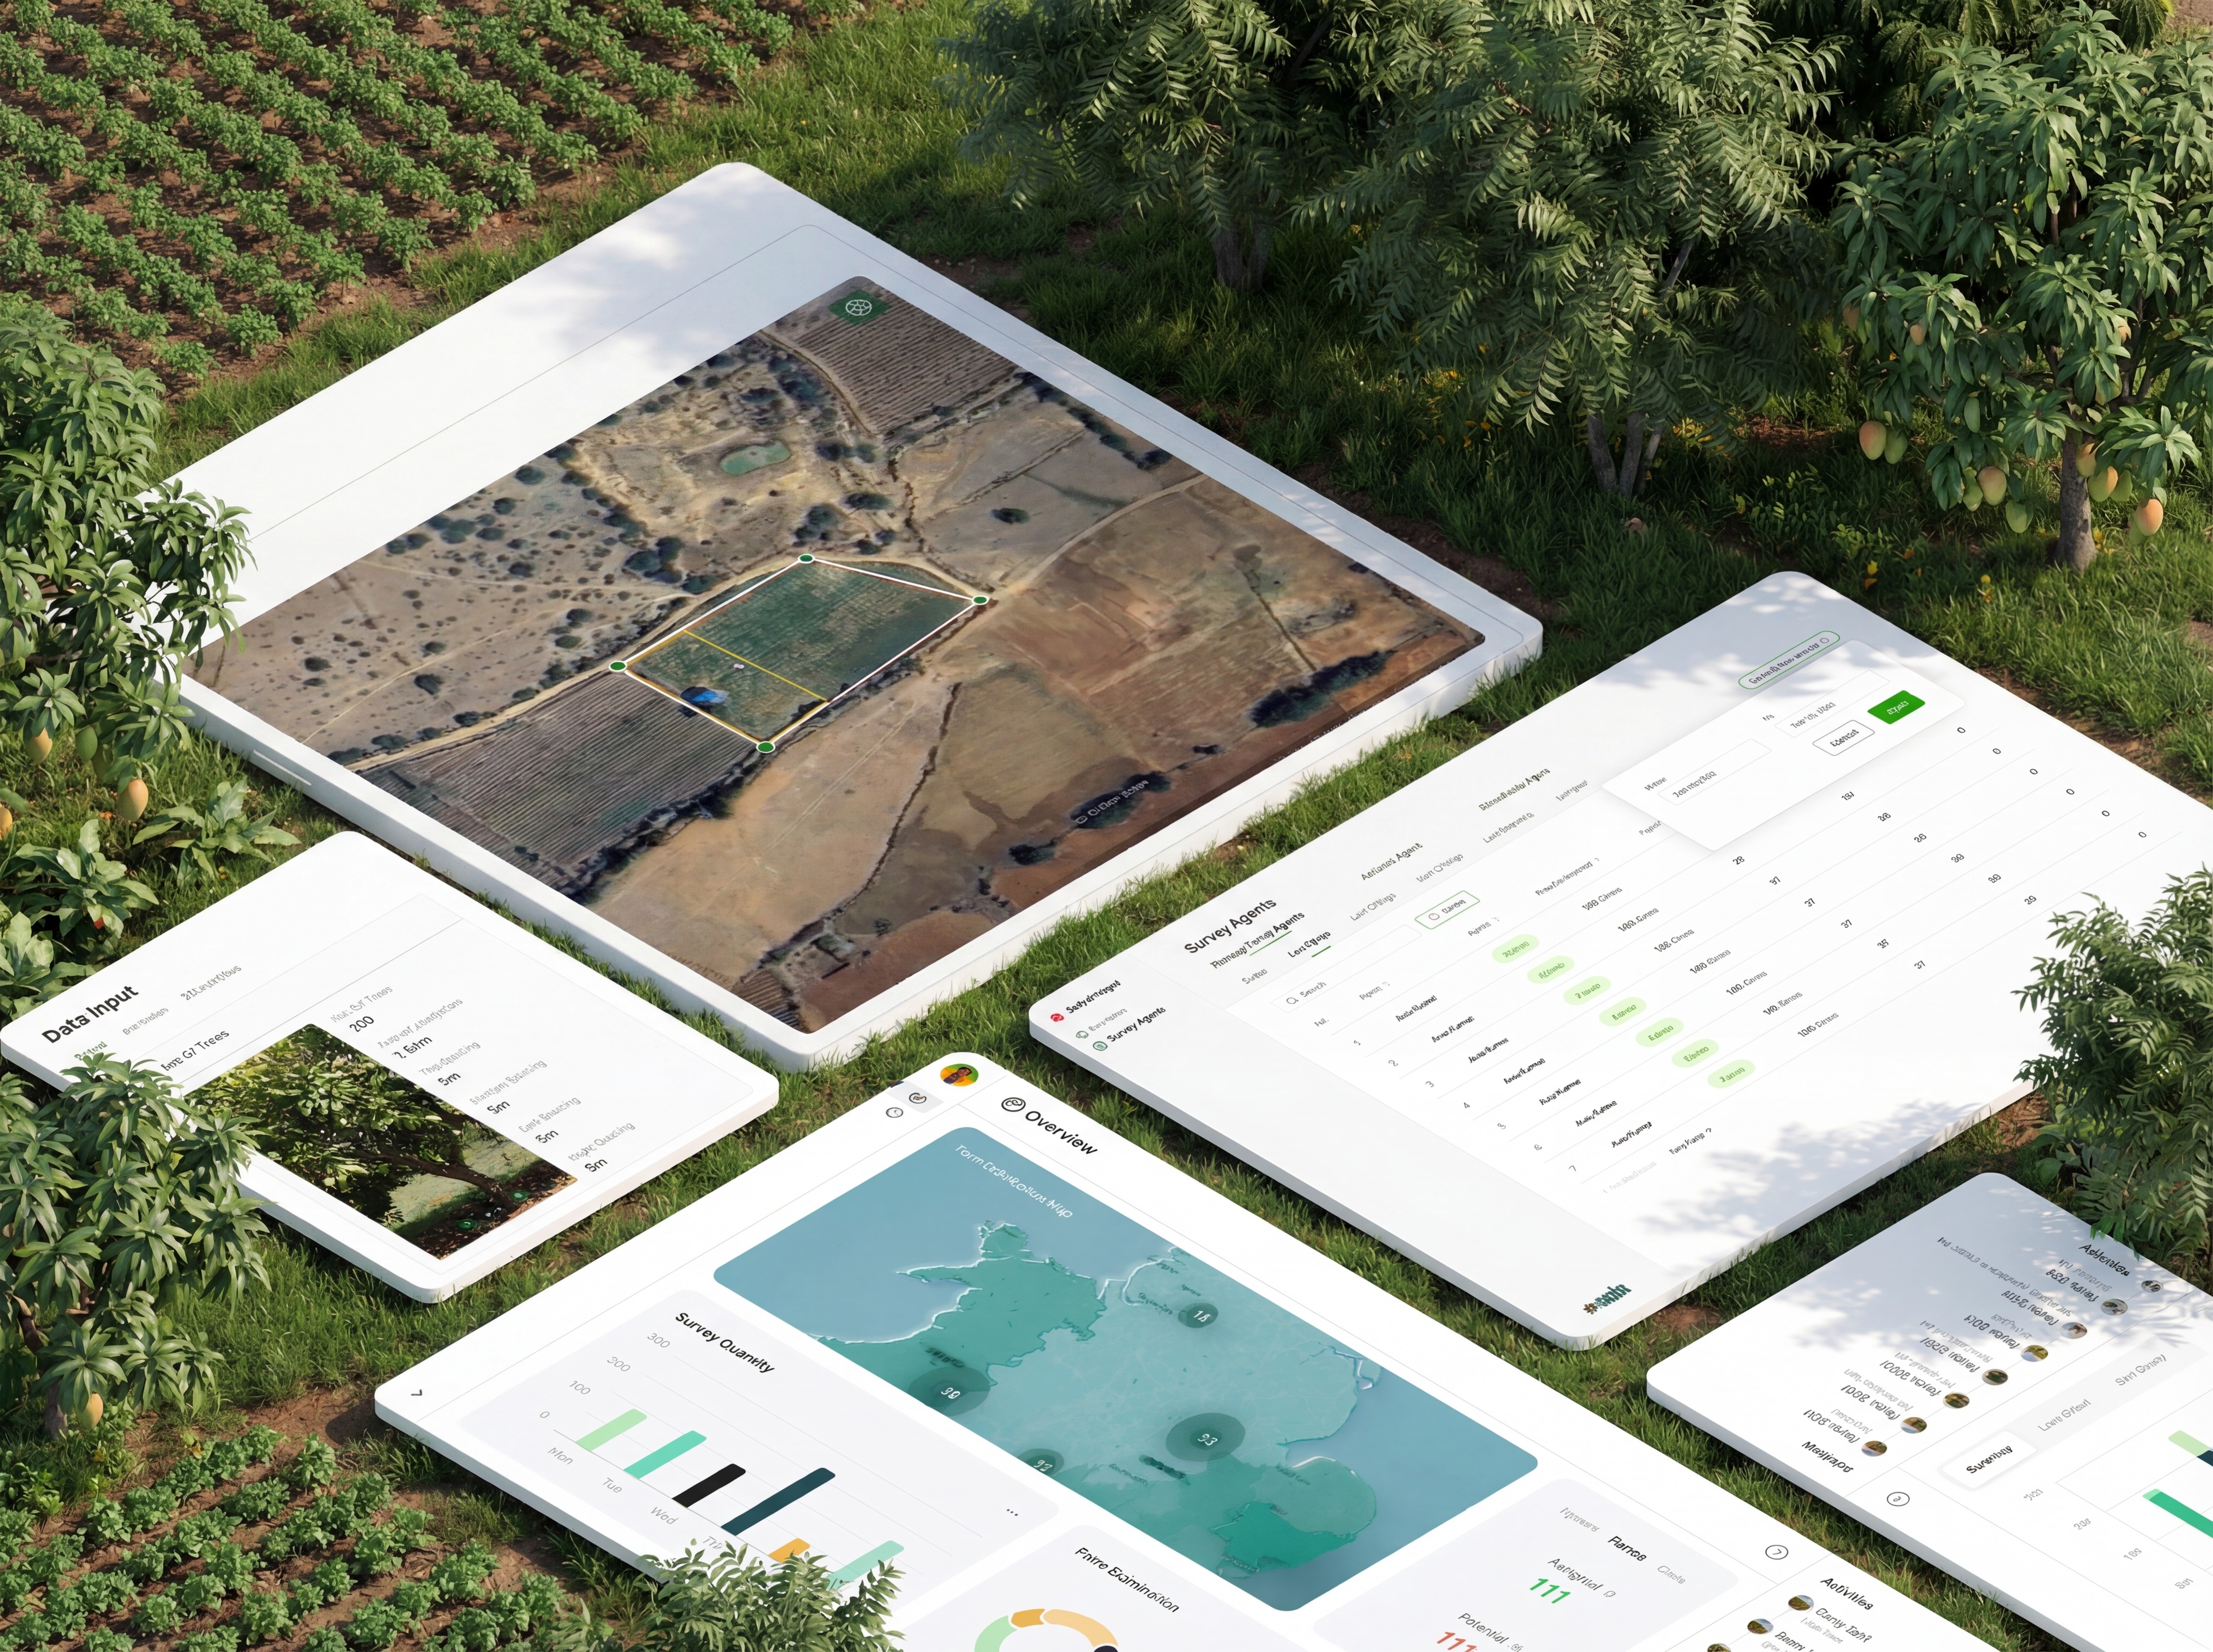
Building the "Validation Engine"
Core Function:
The Studio isn't just for viewing charts. It is the workspace for Human-Level Validation. While satellites check the greenery, internal teams use Studio to manually verify land documents and farmer identities that machines can't check.
Dual-Facing Interface:
We designed the architecture with permission layers. The exact same dashboard is used by internal teams (to do the work) and external carbon buyers (to audit the work), with sensitive PII hidden for the external view. This transparency helps close sales.
The AI-First Workflow
Toolset:
To keep up with the massive scope, I moved beyond Figma. I used Claude Artifacts and Gemini Canvas to cook up live prototypes during meetings. I even used Cursor and MagicPath to hand off code-ready structures to developers, skipping the translation layer entirely.
"Blind Spot" Check:
I recorded stakeholder meetings and fed the transcripts into LLMs to catch requirements I missed and generate roadmap questions, ensuring no edge case was left behind.
Impact
Operational Backbone:
Studio became the "Base" of the company. It is where all ground truth is validated, ensuring that every credit issued is backed by verified data.
Continuous Evolution:
The modular design allows the system to absorb new business lines continuously without technical debt, supporting Varaha’s expansion into new types of climate projects.


The Takeover (Series A Growth)
Context: I inherited the corporate website from an external design agency. As Varaha grew towards Series A, the site needed to evolve rapidly to reflect our new scale.
Execution: I took ownership of the design, adding new project verticals and optimizing the structure to support the funding announcement. I moved it from a static "brochure" to a growing content hub.
The Future Brand (The Framer Prototype)
Pivot: Later, leadership planned a total brand overhaul to accommodate future business lines.
Collaboration: Working with a second UX designer, we interviewed top-level stakeholders to define the new brand voice. We moved beyond static mockups and built a high-fidelity Framer prototype.
Outcome: Although the total rebrand was eventually shelved to prioritize product work, this sprint defined the visual direction for future digital assets.